Home Use Cases Retail & Multichannel
Retail & Distribution Centres

Your store network is changing.
Does your DC have to change too?

Usually not. New stores, changing formats, shifting volumes, seasonal peaks — the Digital Twin shows how your existing DC absorbs it: through better structure, more throughput and processes simulated up front, before you invest in space or a second DC. And because goods are picked store-friendly and arrive on pallets that let the store put goods straight onto the shelf, the DC carries the change — not the stores.

30,000+ users 500+ projects 15+ years
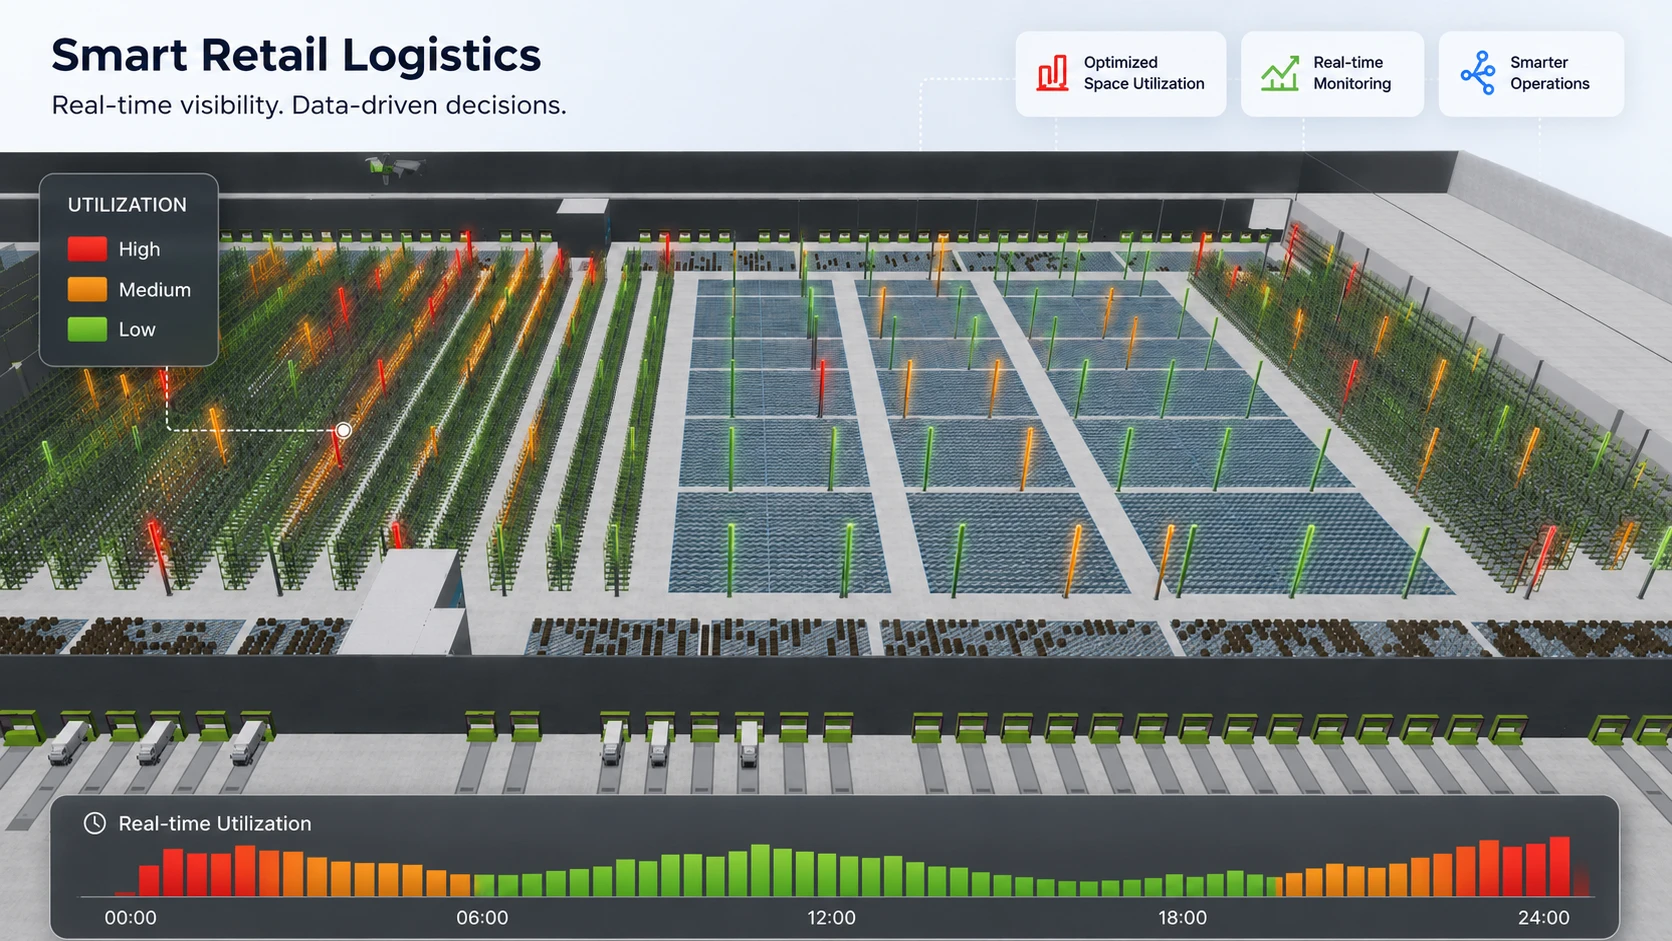
Smart Retail Logistics: a 3D digital twin of a retail distribution centre with a real-time utilisation heatmap (high, medium, low), a live 24-hour utilisation timeline, and callouts for optimised space utilisation, real-time monitoring and smarter operations.
Throughput
up to
+20%

More orders per hour through the same footprint — more store volume without a new build.

In-store restocking
up to
25%

Less handling at the shelf — goods arrive store-friendly, ready to put away.

Shipped air & damage
up to
15%

Stable, well-built pallets: fewer part-pallets, less air, fewer transport damages.

Sound familiar?

Statements we hear again and again in retail distribution.

Five typical situations from a distribution centre — you'll recognise at least one.

The warehouse is full — but nobody knows how much capacity is really in it

Bins and bulk areas have grown over years, not sized to today's assortment. Before anyone talks about a new build or a lease, the simplest question goes unanswered: how many storage locations can we get out of the building we already have?

The store staff re-sort the roll cage before they can even start

Goods arrive in pick sequence, not shelf sequence. Someone in the store has to break the pallet down and re-sort it by aisle before a single item hits the shelf — unpaid, invisible work that repeats in every branch, every day.

Pallets arrive unstable — and half-empty

Cartons stacked without a scheme lean, topple and get damaged in transit, while trucks ship a lot of air. Too many carton and pallet types make it worse, driving up packaging cost and transport volume at the same time.

We plan staff and shifts by gut feel

There's no reliable model that derives headcount, the right shifts and holiday approvals from expected order volume. Load peaks hit the crew unprepared, and in quiet weeks capacity sits idle.

We want to rebuild — and no one can say up front whether it'll work

A new structure, an extra process, picking two stores at once: changes of this magnitude can hardly be tested in live operation without putting something at risk.

Typical objectives

What retail logistics leaders talk to us about.

  • Unlock the hidden capacity in the existing DC — size bins and bulk areas optimally, without building a single square metre
  • Redesign structure and space utilisation — for racking and bulk storage, indoors and out
  • Analyse processes and material flow in the twin and resolve bottlenecks before they show up in operation
  • Derive medium-term capacity and workforce planning from expected order volume
  • Simulate rebuilds, new processes and operating variants — such as picking two stores in parallel — risk-free
  • Pick store-friendly and build stable, store-friendly pallets — shelf-ready, less air, fewer damages
Our approach

From the data model to a laid-out DC.

Five steps that have proven themselves in comparable projects. The first DC twin — modelled, optimised and validated — is typically ready in around 4 months, and the same model extends to further DCs in one system.

01
Week 1–4

Build the DC twin

Turn one distribution centre — layout, racking, pick and dispatch areas, master data, store orders and delivery structure — into a walkable 3D twin in W2MO. Including automated data validation and, where needed, extrapolation of historical order data into structurally faithful future scenarios.

02
Week 3–8

Structure & capacity

Packing algorithms determine the optimal bin and bulk sizing from product properties and inventory data; bulk areas are re-arranged and space utilisation maximised. The result: more net storage capacity from the existing building.

03
Week 6–11

Process simulation & throughput

Material flow, workload and bottlenecks become visible in the twin. Handling equipment can be compared (two- vs. four-pallet forklifts, AMR), and operating variants such as picking two stores in parallel are worked through before they touch the floor.

04
Week 9–14

Store-friendly picking & pallet building

Each store's order is sequenced to its own shelf and aisle layout, and the Package Builder computes stable, store-friendly pallets in 3D — sturdy, low on air, arranged the way the store puts goods away.

05
Week 12–16

Capacity planning & scenario comparison

From expected order volume, headcount, shifts and holiday approvals are derived for the medium term. Growth, market-entry and portfolio scenarios are evaluated side by side against real workloads. The model can later be extended with real-time tracking (see outlook).

The result isn't a one-off study, but a Digital Twin of the DC in which you lay out structure, capacity and processes, plan staffing — and evaluate every change before it touches the floor.

The retail difference

Optimised all the way to the store.

In a distribution centre the goal isn't just efficient operation — it's a robustly laid-out floor and a shipment the store can put away without re-sorting. Four levers make that happen, and the twin evaluates them together.

More capacity from the same building

Packing algorithms size bins and bulk areas optimally and re-arrange the floor — for higher net storage capacity and a better fill level, without building a single square metre. In bulk storage the change is simple: adjust the floor markings, redefine locations in the WMS.

Understand processes & throughput in the twin

Simulation and analysis make workload, bottlenecks and congestion visible — and let you evaluate handling equipment, process variants and operating models such as parallel store picking before they're implemented.

Store-friendly picking

Orders are picked in each store's own shelf and aisle sequence, so the roll cage or pallet arrives sorted the way the store stocks its shelves. Less handling at the shelf, faster replenishment, fewer errors — multiplied across every branch, every day.

Store-friendly pallet building

The Package Builder computes stable 3D pallets that respect stackability, fragility and orientation — and can follow the store's put-away logic. Sturdier pallets mean fewer transport damages; better-filled pallets mean less shipped air and fewer trucks.

Safe to experiment. Because it all happens in the twin, bold changes — new structures, new processes, automation options — can be evaluated with zero risk to live operation before anything is committed on the floor.

Outlook

From the planned DC to the real-time DC.

The Digital Twin lays out structure, capacity and processes — the Real-Time Digital Twin closes the loop. AI cameras track forklifts, people and pallets and feed the actual movements back into the same model. That lets you check whether the floor delivers in operation what the plan promised — and every later layout starts from real rather than assumed data.

Test planning assumptions against reality

Tracked paths, speeds and idle vs. productive times appear as a heatmap right in the model and show where the real flow deviates from the plan.

One data source for every algorithm

The real-time data becomes the basis for the same W2MO optimisations (capacity, structure, pallet building, picking), without moving the data into another tool.

What-if on real data

Scenarios and rebuilds can be computed against the actual order and movement situation, not just against historical values.

More on the Real-Time Digital Twin →
Gen AI in production

Talk to your DC — not to your reports.

Via MCP servers, Claude, Gemini or ChatGPT access your warehouse data directly — no more hand-prepared data sets.

Natural language, not menus

"Show me capacity utilisation by zone." "Simulate the Christmas assortment and compute the headcount." Straight from the chat.

MCP server as the bridge

The W2MO MCP architecture gives AI models direct access to warehouse data, KPIs, optimisation algorithms and simulation results — with no interface engineering.

Bring your own AI model

Connect any LLM — Claude, ChatGPT, Gemini or your own — via the W2MO MCP server. You pick the model, you control the data. No vendor lock-in.

Play through scenarios in conversation

"What happens if 30 new stores come online?" "Simulate two stores in parallel." The AI model kicks the calculation off directly in the twin and returns the impact on throughput and capacity — without anyone configuring the scenario by hand.

What used to take days — preparing KPIs, configuring scenarios, recomputing capacity models — now runs in minutes of conversation.
Order of magnitude

What we typically measure in the field.

up to +20%

More throughput — more orders, and so more stores, from the same DC.

+6 to +25%

More net storage capacity from the existing building, where space is the bottleneck.

−20 to −25%

Less in-store handling time through store-friendly goods and pallets.

0risk

Validated in simulation before the first item is moved.

The ranges shown are typical project results. The concrete potential depends on the starting state of your DC, store footprint and order structure — and can be quantified in a few days through an initial analysis.

Trust

Logivations — numbers you can rely on.

30,000+
Professional W2MO users
500+
Consulting projects
15+
Years in practice
Retail & Multichannel E-Commerce FMCG Beverages Pharma Automotive Industrial goods
Frequent questions

What customers ask us before the project.

How much capacity is in our existing DC?

The twin determines that in the first step — in both dimensions that limit a distribution centre. On the space side, packing algorithms compute the optimal bin and bulk sizing from product properties and inventory data and re-arrange the floor; a typical result is 6–25 % more net storage capacity. On the throughput side, simulation shows how many orders — and so how many stores — your DC can handle with optimised structure, better paths and adjusted processes; here we regularly see up to +20 % throughput. Within a few days, the initial analysis shows which of the two is your real bottleneck — both without a new build.

Can we simulate rebuilds or a parallel store line in advance?

Yes. Structure, process and operating variants — such as picking two stores at once, a different handling vehicle or a new layout — are worked through in the twin and evaluated against real workloads, bottlenecks and load peaks before anything is changed on the floor.

What exactly is "store-friendly" picking?

Instead of picking in warehouse-pick sequence, we pick a store's order in the store's own shelf and aisle sequence. The pallet or roll cage arrives sorted the way the store stocks its shelves, so staff can put it away directly — with far less re-sorting and fewer errors.

How does store-friendly pallet building work?

The W2MO Package Builder computes an optimal 3D packing scheme for each pallet — respecting stackability, fragility and orientation — and can follow the store's put-away logic. The result is a sturdier, better-filled pallet: fewer transport damages, less shipped air, and a delivery the store doesn't have to rebuild.

Do we have to change everything at once?

No. You can start with a single lever — capacity, structure, pallet building or picking — and add the others later. Because they all live in the same Digital Twin, each step builds on the last rather than becoming a separate project.

Our DC runs a specific WMS — does that work?

Yes. The twin sits above the WMS layer. Results for capacity, structure, sequences and pallet schemes flow back into your system — SAP EWM, WM/LES via the W2MO SAP connector, or other WMS via RESTful APIs.

How long does such a project usually take?

The first DC twin — modelled, optimised and validated — is typically ready in around 4 months, depending on size and data availability. From there the same model extends to further DCs or further levers.